Late COE Analysis Oct '24: Premiums still trending upwards
31 Oct 2024|5,243 views
COE price trend over the past quarter: July to Sep 2024 vs April to June 2024 (and... also bits of October)
The LTA's atypical release of the COE quota numbers for the next quarter meant that we were caught by surprise back at the start of the month - but in case there were doubts, no, we didn't forget about our quarterly COE analysis.
You would have seen by now that the COE supply for the November to January stretch is set to rise again, by another 4% - fully in line with the general promises laid out by the authorities a while back. Unless you've been completely off the grid, one very eye-popping announcement, made just yesterday, should have caught your attention too.
But let's get back first to the hard, indisputable figures. As October comes to a close with a couple of notable events in tow, and as we stand right at the cusp of the incoming COE quota period, here's a quick recount of how prices have trended since July.
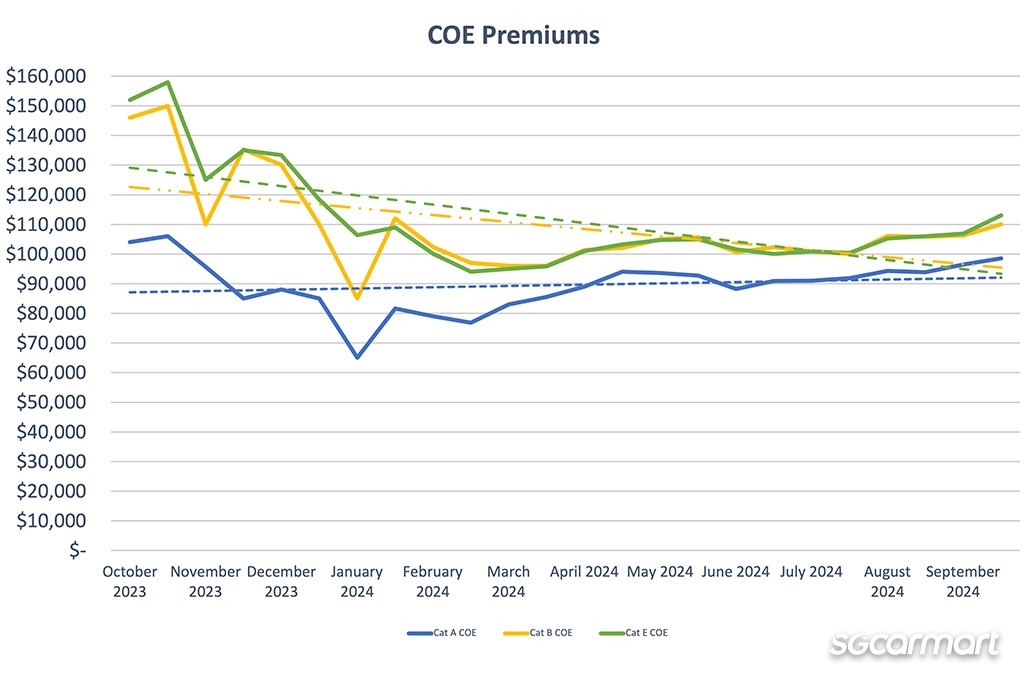
Sticking more strictly first to the quarter-versus-quarter numbers, COE premiums rose yet again across all categories when averaged out over July to September earlier this year in comparison to the earlier quarter spanning April to June.
In our previous analysis, we noted that prices in Cat A had risen especially sharply - by 16.5% - but the increase was less pronounced this time: By a far gentler 3.2%. Cats B and E experienced similarly soft rises of 2% and 2.8% respectively.
That's not to say that this has been good news for car buyers, though. The same, objective rejoinder to these softer numbers is the fact that any increase in premiums should still be alarming, especially considering that the COE quota has been on a consistent rise.
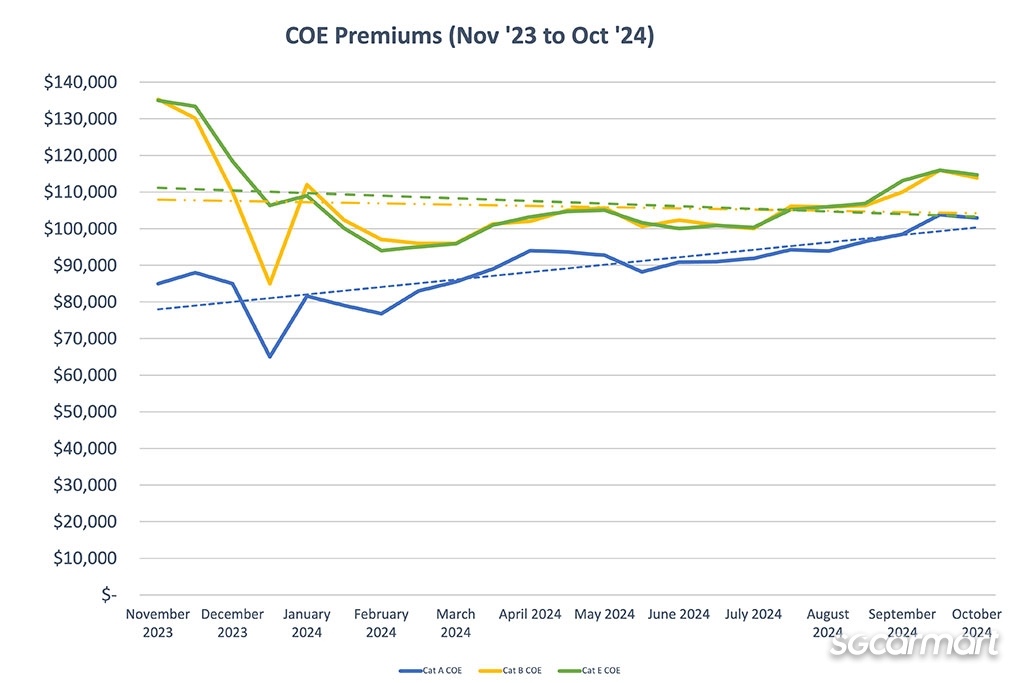
And this holds all the more when one additionally factors the month of October in.
Cat A, particularly, saw premiums breaking once more past the $100,000 barrier in the first bidding round of the month. They've since slid back down slightly - but again, we’re seeing new car prices stand at the highest that they've been for a few months now.
You'll also notice that the trend line for Cat A rises in a more pronounced fashion with October taken into calculation; those for Cats B and E, on the other hand, have grown gentler despite still sloping downwards.
In the past, we've pointed to factors such as the swelling Cat A segment and also massive sales exercises, such as the Singapore Motor Show and The Car Expo, and as potential reasons why prices don't seem to be coming down. (On that note, October's The Car Expo couldn't possibly be blamed for the massive spike in the month's first bidding round; it happened the weekend after.)
The fact that premiums have continued to rise despite the bolstered COE supply can only mean that demand in the new car market is still going strong
And while those factors shouldn't be discounted entirely, in the ostensible absence of them having exceptionally strong effects on the past quarter, another plain possibility should be clear: Demand is still strong for new cars. Prices can only rise when demand outpaces supply - and just to remind you again, the COE supply has been on the rise.
Don't expect the strong demand to go away too soon, considering the aggression with which new brands and new models are continuing to make landfall in Singapore.
July to September played host to three completely new Chinese brands - XPENG, ZEEKR and Dongfeng - launching their first models here. The three-month stretch also saw a particularly stacked schedule of car launches (we counted more than 15 new or facelifted models arriving, compared to half that amount in the previous quarter).
New brands (overwhelmingly Chinese, and fully electric) have continued to arrive on our shores with steady pace
In October, DENZA arrived with the D9 as well, while BYD introduced the M6 MPV - with pre-orders for both cars eclipsing 300 and 400 units respectively already at their official launch times.
Still, to return to what we mentioned at the beginning, a new factor will soon come into play starting from February 2025: A one-off additional injection of up to 20,000 COEs, set to impact the quota pool over the next few years. The LTA states that the decision was made after considering recent and impending enhancements to the nation's ability to manage congestion.
Whether or not this really puts the lid on rising COE premiums remains to be seen; when exactly the injections will arrive, and to what sorts of degrees at each point too, is likely to stay opaque.
Nonetheless, any sign of relief during a protracted period of pain for car-buyers - no matter how small or big - can only be a good thing.
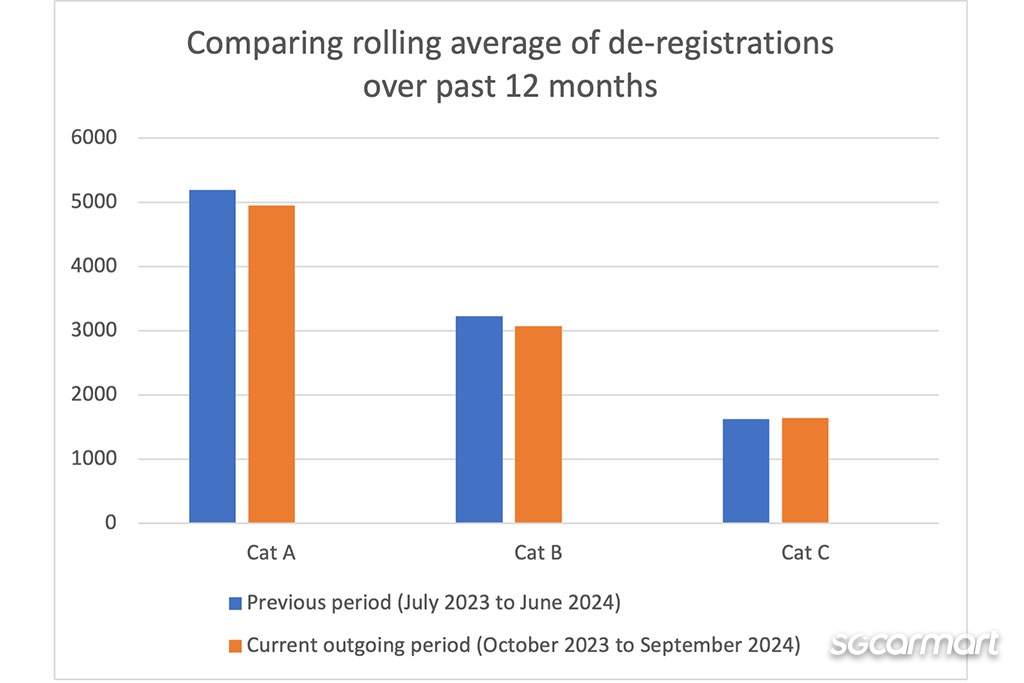
Vehicle de-registrations from July to September: A slight dip from the previous quarter
As mentioned earlier, the LTA has already revealed that the COE quota for the November to February will rise - and either way, the continued adoption of the 'cut-and-fill' method would have all but guaranteed that reality, too. With September's de-registration figures also already in, we haven't had to fill in the blanks via any sorts of data extrapolation this time either.
Interestingly, the data for the past quarter revealed an overall 4% dip in de-registrations, led by 5% dip in Cat A and also a 5% dip in Cat B too. De-registrations in Cat C (for commercial vehicles), meanwhile, saw a slight 1% increase.
Portions of de-registrations from Cat A, B and C all contribute to the supply pool in the open Cat E as well. We're not privy to how exactly the LTA calculates its numbers, but there's no reason to be alarmed - the authority has promised that COE supply will continue to rise up till 2026. It may very well be that the July-to-September quarter was just a small blip.
Again, however, in light of the impending injection of 20,000 additional COEs, how de-registrations swing from quarter to quarter may be less significant in understanding the COE supply for the upcoming quarter anyway.
New car prices: July to September
Sgcarmart does its best to use a pool of popular models from authorised dealers to analyse the general price trends of new cars.
In tandem with the slight increased in COE premium, new car prices have continued to creep upwards too. Based on our sample, they rose 1.5% rise over the July to September quarter, when compared to the tri-monthly average between April to June.
Again, this increase in prices is commensurate to the movement of COE premiums - especially when you note that prices for Cat A cars have risen just that bit more steeply than those for Cat B ones. (Dealers notably held prices relatively level through August, before letting them rise after mid-September.)
If you're looking at current car prices and wondering whether this figure mispaints the current picture (by underselling it), it's worth noting that we haven’t factored October's prices in for consistency with the calculations depicted above. If we had, however, the increase would have certainly been more noteworthy.
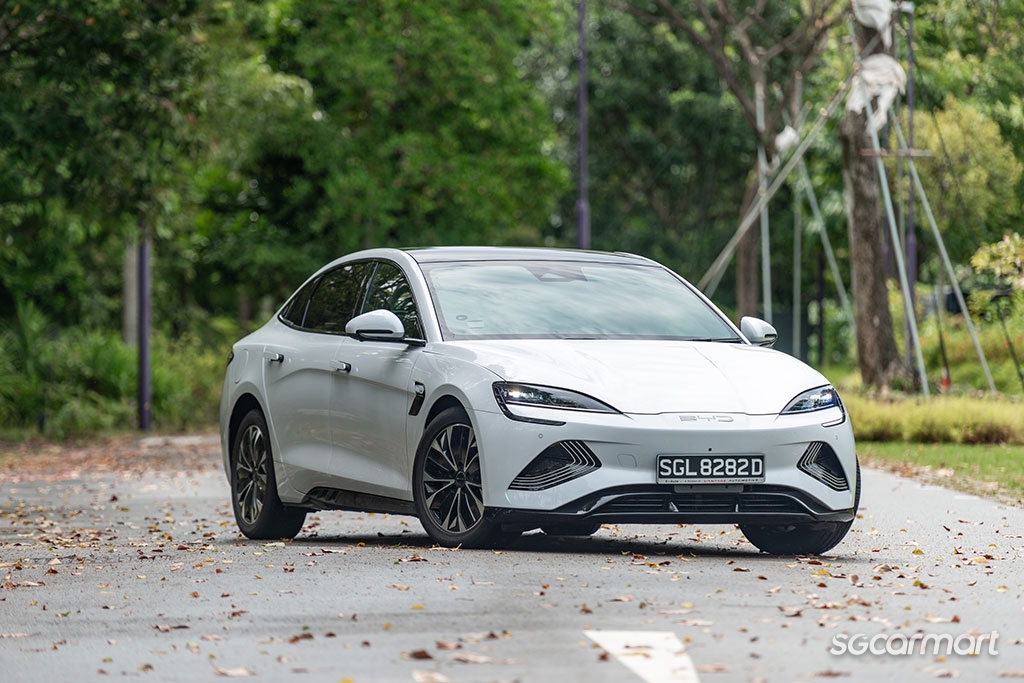
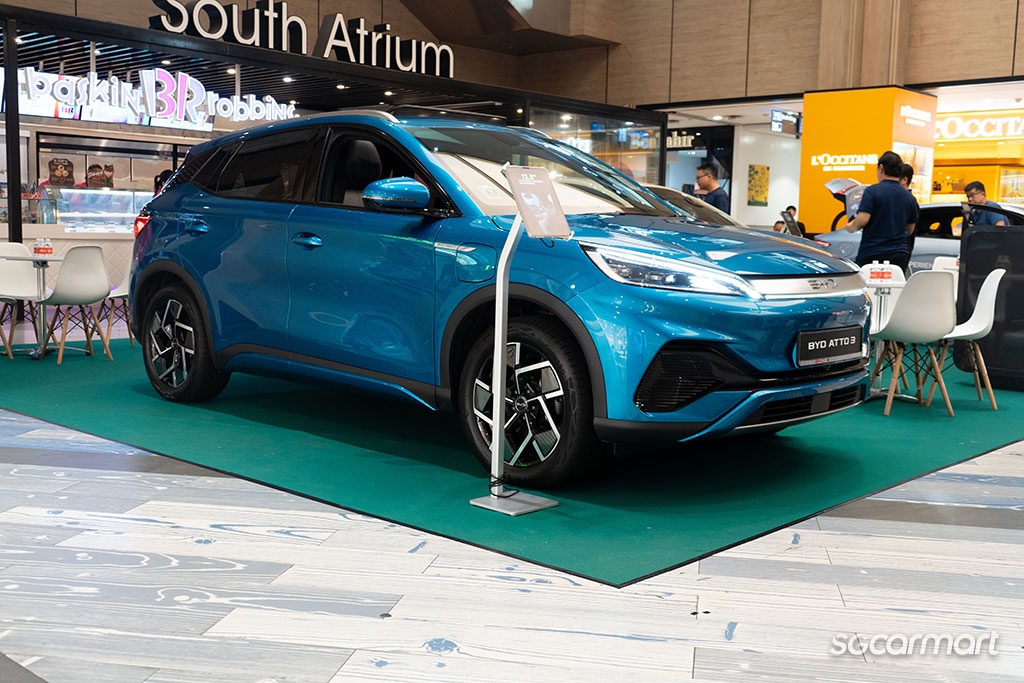
At the moment, for instance, prices for the Cat A-friendly BYD Atto 3 start at close to $180,000 (inclusive of COE), compared to slightly over $160,000 at end-June.
Most popular used cars: June to August 2024
Over the three-month period between June to August 2024, these were the five most listed used cars on Sgcarmart.
| Model | Year of registration | Average depreciation (approx.) |
| Honda Vezel 1.5A X | 2016 | $14,368 |
| Mercedes-Benz C-Class C180 Avantgarde | 2017 | $19,922 |
| Honda Civic 1.6A VTi | 2018 | $15,174 |
| Nissan Qashqai 1.2A DIG-T | 2016 | $12,762 |
| Mazda 3 1.5A Sunroof | 2017 | $12,022 |
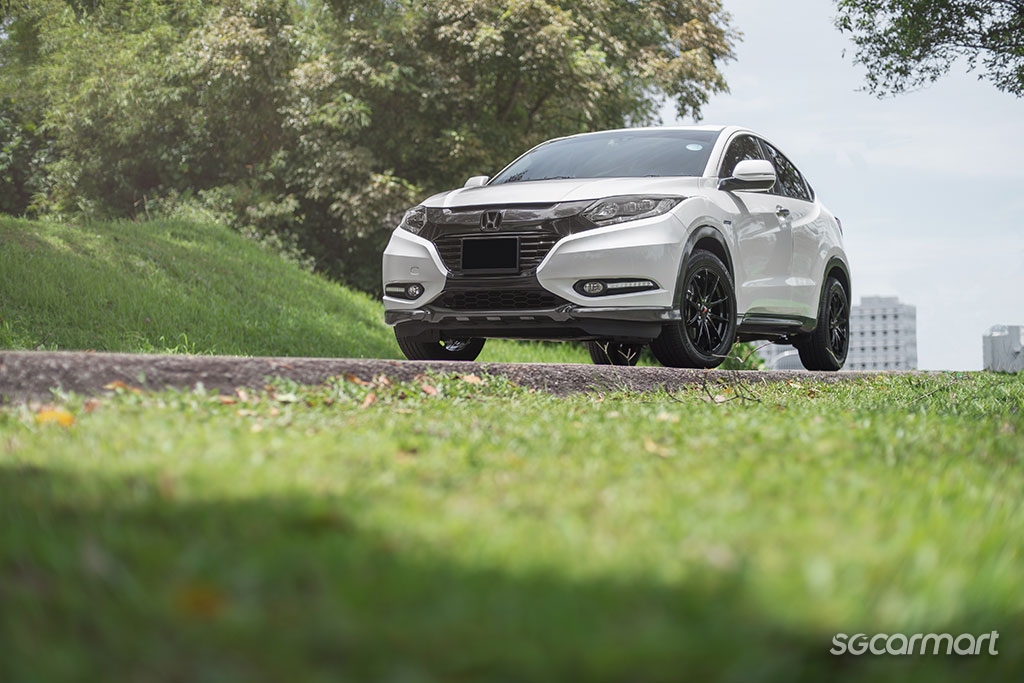
Using the evergreen 2016-registered Honda Vezel as the general market yardstick once more, you'll note that the annual depreciation figure of $14,368 for this three-month period marked yet another drop, compared to $14,982 previously. Likewise, depreciation figures for the 2016 Nissan Qashqai 1.2 also slid compared to the previous period.
Considering that new car prices are picking up again (and that we are, after all, a bit delayed in our analysis), it will be interesting to see if this downwards trend in the used car market continues to hold.
On the one hand, if new car prices continue to increase, the parallel resurgence of used car prices would indicate that consumers are still turning to the pre-owned market.
Conversely, however, a persisting deflation of used car prices amidst a booming new car market would indicate that demand for pre-owned options is weakening - and perhaps even indicate that a certain level of acceptance has set in for the current COE climate.
Here's a recap of our past three analyses!
COE Analysis July '24: Is $90-100k the new normal?
Thank You For Your Subscription.


